MacSpectrum User Instructions
updated 04/19/2019
- Introduction
- Data File Preparation
2.1 The Gene-Sample Table
2.2 Filtering the Gene-Sample Table (recommended)
2.3 The Feature File - Run a Query
- Reference
1. Introduction
MacSpectrum is a macrophage annotation system that allows comprehensive analysis of heterogeneous subpopulation and their multifaceted activation states under various in vitro and in vivo conditions. Each subpopulation identified by this system can be analyzed for cell function, intracellular signaling networks, and condition-specific signature genes.
1.1 Two Indices:
MacSpectrum depicts macrophage subpopulations using two indices:
Macrophage Polarization Index (MPI): MPI values range from -50 to 50 (units). Higher MPI value suggests higher inflammatory features.
Activation induced Macrophage Differentiation Index (AMDI): AMDI values range from -50 to 50 (units). Higher AMDI value suggests more maturity in macrophage terminal differentiation.
Due to the nature of the cell culture process, in vitro cultured macrophages (either cell lines or primary cultures) often present fully matured macrophage properties, thus would not be properly depicted by AMDI in sample comparisons. Use caution when interpreting AMDI results of in vitro macrophage samples.
For further information, please refer to our publication [1].
1.2 MacSpectrum Version 1.0 provides two functions:
a. Generating a MacSpectrum Plot
b. Generating a signature gene list from macrophage subsets identified by MacSpectrum
Other functions, including query for gene expression pattern in the existing transcriptome profiles, will be provided in the next version. For specific questions, please contact us.
2. Data File Preparation
A gene-sample table and a feature file will need to be uploaded to run a query on MacSpectrum.
2.1 The Gene-Sample Table
The gene-sample table is a table (matrix) containing the gene expression levels of your dataset.
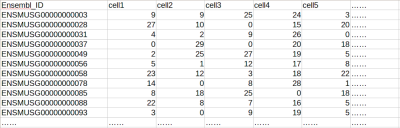
In the table, rows are genes and columns are samples (e.g. individual single cells, regular RNA-seq samples, qPCR samples, etc. see example below). The first column contains Ensembl IDs of the genes, and other columns are gene expression levels of each cell or sample, in UMI, FPKM/RPKM, TPM format or other relative expression formats (eg. qPCR results).
The table should be saved as a comma-separated values (.csv) file, which can be done using most common spreadsheet software (Excel, LibreOffice, etc.).
Currently, mouse or human Ensembl IDs are supported. Human genes in your sample dataset will be automatically mapped to their murine homologs using MGI homology [2]. We provide two worktables to facilitate converting from Gene Names (e.g. NOS2/Nos2 ) to Ensembl IDs for human and mouse genes. Note that not all Gene Names have corresponding Ensembl IDs, so some of genes will be labelled as “#N/A”; this is fine, as MacSpectrum will automatically filter them out before the calculations.
Example of a typical gene-sample table for a single-cell RNAseq dataset (UMI values)
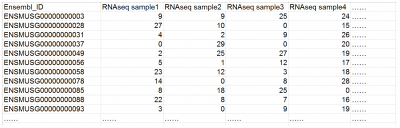
Example of a typical gene-sample table for a regular RNAseq dataset (RPKM / FPKM / TPM values)
2.2 Filtering the Gene-Sample Table (recommended but not required)
Filtering out low expression genes from the gene-sample table is recommended.
Although not required by MacSpectrum, this filtering step can help avoid noise from low expression genes, and often significantly reduces the time needed for generating the MPI-signature genes and the gene-MPI heatmap.
The filter cutoff may be set according to the features of your dataset (e.g., FPKM/UMI ≥1 in at least one sample, or genes that are expressed in >1% of total samples), and can be done using various tools (e.g., Excel, LibreOffice, R, etc.).
2.3 The Feature File
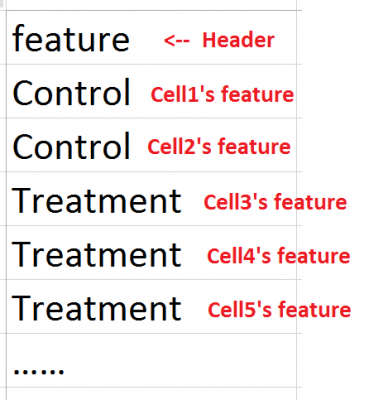
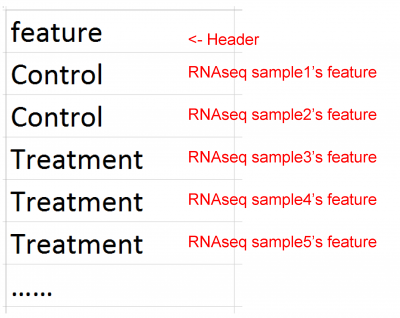
The feature file should be a single column .csv file, which contains any features of the samples (treated/control, disease/healthy, etc.). The features should be of the same number and order as the samples in the gene-sample table (e.g., cell1, cell2, cell3, etc.; or sample1, sample2, sample3, etc.; as in the example table above).
Example of a typical feature file for a single-cell RNAseq dataset.
Example of a typical feature file for a regular RNAseq dataset.
3. Run a Query
1. Launch the MacSpectrum (version 1.0) program.
2. Select “mouse” or “human” for sample origin of your dataset.
3. Click “Upload” buttons to upload the gene-sample table file and the feature file.
We recommend including the sample ids as the header (the first row) of your gene-sample table file, as shown in the example above (Cell1, Cell2, …or Sample1, Sample2…). If your gene-sample table file and feature file do not contain headers, you can uncheck the Header check box, however, this is not recommended because the MPI/AMDI results will not be annotated by sample ids (as they are not provided in your upload file).
4. Click “Go!” to run the calculation.
Depending on the size of your dataset, the calculation may take one or several minutes. Human samples may take extra time due to the procedure of mapping to mouse gene homologs.
5. Calculating MPI/AMDI and visualizing your data.
When the calculation is complete, a summary table and several plots will appear in the output area on the right side of the webpage.
The summary table will show the calculated MPI and AMDI of the first 10 samples (or all your samples if there are less than 10 samples in your dataset).
Below the summary table, several plots will show density distributions of your samples’ MPI/ AMDI, and distribution of your samples on the MPI vs. AMDI map as dots or contours.
You can download the complete results of the calculated MPI/AMDI values of your samples by clicking the “Download MPI/AMDI” button.
6. Generating MPI-signature genes and heatmap (optional)
After calculating the MPI/AMDI of your samples using the “Go!” button, you can download the calculated MPI/AMDI (as stated above in 5.) and MPI-signature genes, and you can generate a heatmap showing the trend of gene expression across MPI values:
a. Click the “Download Sig Gene” button to download the MPI-signature genes.
This will generate a table showing differential expression of genes in your dataset between the high-MPI half (50%) and the low-MPI half (50%) of your samples. Depending on the size of your dataset, preparation of the MPI-signature gene download may take several minutes.
*If your browser timed out after you clicked the “Download Sig Gene” (this usually happens when your macrophage dataset is relatively large), click the “Make Heatmap” first (see part b. bellow); after the Gene-MPI Heatmap is generated, then click “Download Sig Gene” to download the MPI-signature genes.
b. Click the “Make Heatmap” button to generate a Gene-MPI Heatmap.
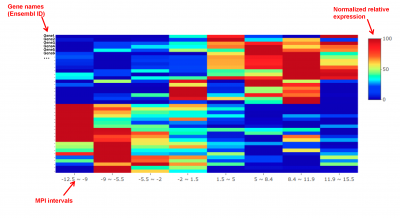
The gene-MPI heatmap will depict the trend of gene expression levels along the MPI scale ( 50 to +50 units). By clicking the button, MacSpectrum will:
1) take the 20 most up- and down-regulated MPI-signature genes;
2) divide the whole range of your samples’ MPI values into 8 intervals;
3) calculate the average expression of the genes in samples within each MPI-interval;
4) transform the gene expression levels into a 0 to 100 relative scale, and generate the heatmap accordingly, as shown in the following figure:
The gene-MPI heatmap is optimized for datasets that contain a relatively large number of samples (e.g., ~200) that present a relative continuous distribution of MPI values.
An example of a gene-MPI heatmap.
MacSpectrum uses ggplot2 [3] and plotly [4] for data visualization.
At current stage, due to limitations of profiling technology, MacSpectrum aims to provide fine-mapping information of monocytes/macrophages within each study, rather than cross-study comparison. We acknowledge that the model can be further strengthened and applied to human diseases when more unified standards in the profiling technology and more monocyte/macrophage datasets are available.